


Tides are one of the most reliable phenomena in the world. As the sun rises in the east and the stars come out at night, we are confident that the ocean waters will regularly rise and fall along our shores. The following pages describe the tremendous forces that cause the world’s tides, and why it is important for us to understand how they work.
Basically, tides are very long-period waves that move through the oceans in response to the forces exerted by the moon and sun. Tides originate in the oceans and progress toward the coastlines where they appear as the regular rise and fall of the sea surface. When the highest part, or crest of the wave reaches a particular location, high tide occurs; low tide corresponds to the lowest part of the wave, or its trough. The difference in height between the high tide and the low tide is called the tidal range.
A horizontal movement of water often accompanies the rising and falling of the tide. This is called the tidal current. The incoming tide along the coast and into the bays and estuaries is called a flood current; the outgoing tide is called an ebb current. The strongest flood and ebb currents usually occur before or near the time of the high and low tides. The weakest currents occur between the flood and ebb currents and are called slack tides. In the open ocean tidal currents are relatively weak. Near estuary entrances, narrow straits and inlets, the speed of tidal currents can reach up to several kilometers per hour (Ross, D.A., 1995).

Gravity is one major force that creates tides. In 1687, Sir Isaac Newton explained that ocean tides result from the gravitational attraction of the sun and moon on the oceans of the earth (Sumich, J.L., 1996).
Newton’s law of universal gravitation states that the gravitational attraction between two bodies is directly proportional to their masses, and inversely proportional to the square of the distance between the bodies (Sumich, J.L., 1996; Thurman, H.V., 1994). Therefore, the greater the mass of the objects and the closer they are to each other, the greater the gravitational attraction between them (Ross, D.A. 1995).
Tidal forces are based on the gravitational attractive force. With regard to tidal forces on the Earth, the distance between two objects usually is more critical than their masses. Tidal generating forces vary inversely as the cube of the distance from the tide generating object. Gravitational attractive forces only vary inversely to the square of the distance between the objects (Thurman, H.V., 1994). The effect of distance on tidal forces is seen in the relationship between the sun, the moon, and the Earth’s waters.
Our sun is 27 million times larger than our moon. Based on its mass, the sun’s gravitational attraction to the Earth is more than 177 times greater than that of the moon to the Earth. If tidal forces were based solely on comparative masses, the sun should have a tide-generating force that is 27 million times greater than that of the moon. However, the sun is 390 times further from the Earth than is the moon. Thus, its tide-generating force is reduced by 3903, or about 59 million times less than the moon. Because of these conditions, the sun’s tide-generating force is about half that of the moon (Thurman, H.V., 1994).
Gravity, Inertia, and the Two Bulges
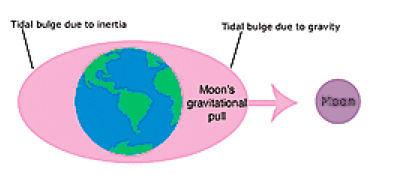
Gravity is a major force responsible for creating tides. Inertia, acts to counterbalance gravity. It is the tendency of moving objects to continue moving in a straight line. Together, gravity and inertia are responsible for the creation of two major tidal bulges on the Earth (Ross, D.A., 1995).
The gravitational attraction between the Earth and the moon is strongest on the side of the Earth that happens to be facing the moon, simply because it is closer. This attraction causes the water on this “near side” of Earth to be pulled toward the moon. As gravitational force acts to draw the water closer to the moon, inertia attempts to keep the water in place. But the gravitational force exceeds it and the water is pulled toward the moon, causing a “bulge” of water on the near side toward the moon (Ross, D.A., 1995).
On the opposite side of the Earth, or the “far side,” the gravitational attraction of the moon is less because it is farther away. Here, inertia exceeds the gravitational force, and the water tries to keep going in a straight line, moving away from the Earth, also forming a bulge (Ross, D.A., 1995).
In this way the combination of gravity and inertia create two bulges of water. One forms where the Earth and moon are closest, and the other forms where they are furthest apart. Over the rest of the globe gravity and inertia are in relative balance. Because water is fluid, the two bulges stay aligned with the moon as the Earth rotates (Ross, D.A., 1995).
The sun also plays a major role, affecting the size and position of the two tidal bulges. The interaction of the forces generated by the moon and the sun can be quite complex. As this is an introduction to the subject of tides and water levels we will focus most of our attention on the effects of the stronger celestial influence, the moon.
Changing Angles and Changing Tides

As we’ve just seen, the Earth’s two tidal bulges are aligned with the positions of the moon and the sun. Over time, the positions of these celestial bodies change relative to the Earth’s equator. The changes in their relative positions have a direct effect on daily tidal heights and tidal current intensity.
As the moon revolves around the Earth, its angle increases and decreases in relation to the equator. This is known as its declination. The two tidal bulges track the changes in lunar declination, also increasing or decreasing their angles to the equator. Similarly, the sun’s relative position to the equator changes over the course of a year as the Earth rotates around it. The sun’s declination affects the seasons as well as the tides. During the vernal and autumnal equinoxes—March 21 and September 23, respectively—the sun is at its minimum declination because it is positioned directly above the equator. On June 21 and December 22—the summer and winter solstices, respectively—the sun is at its maximum declination, i.e., its largest angle to the equator (Sumich, J.L., 1996).
Frequency of Tides – The Lunar Day
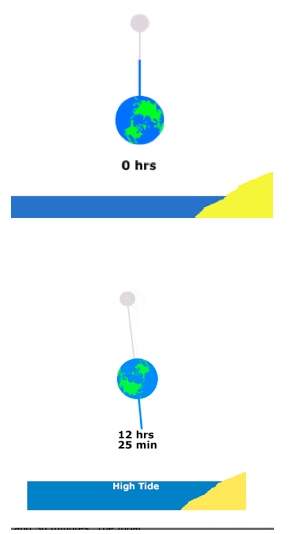
Most coastal areas, with some exceptions, experience two high tides and two low tides every lunar day (Ross, D.A., 1995). Almost everyone is familiar with the concept of a 24-hour solar day, which is the time that it takes for a specific site on the Earth to rotate from an exact point under the sun to the same point under the sun. Similarly, a lunar day is the time it takes for a specific site on the Earth to rotate from an exact point under the moon to the same point under the moon. Unlike a solar day, however, a lunar day is 24 hours and 50 minutes. The lunar day is 50 minutes longer than a solar day because the moon revolves around the Earth in the same direction that the Earth rotates around its axis. So, it takes the Earth an extra 50 minutes to “catch up” to the moon (Sumich, J.L., 1996; Thurman, H.V., 1994).
Because the Earth rotates through two tidal “bulges” every lunar day, coastal areas experience two high and two low tides every 24 hours and 50 minutes. High tides occur 12 hours and 25 minutes apart. It takes six hours and 12.5 minutes for the water at the shore to go from high to low, or from low to high.
Tidal Variations – The Influence of Position and Distance
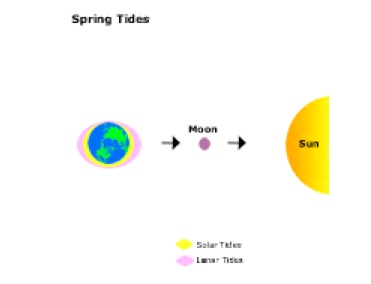
The moon is a major influence on the Earth’s tides, but the sun also generates considerable tidal forces. Solar tides are about half as large as lunar tides and are expressed as a variation of lunar tidal patterns, not as a separate set of tides. When the sun, moon, and Earth are in alignment (at the time of the new or full moon), the solar tide has an additive effect on the lunar tide, creating extra-high high tides, and very low, low tides—both commonly called spring tides. One week later, when the sun and moon are at right angles to each other, the solar tide partially cancels out the lunar tide and produces moderate tides known as neap tides. During each lunar month, two sets of spring tides and two sets of neap tides occur (Sumich, J.L., 1996).

Just as the angles of the sun, moon and Earth affect tidal heights over the course of a lunar month, so do their distances to one another. Because the moon follows an elliptical path around the Earth, the distance between them varies by about 31,000 miles over the course of a month. Once a month, when the moon is closest to the Earth (at perigee), tide-generating forces are higher than usual, producing above-average ranges in the tides. About two weeks later, when the moon is farthest from the Earth (at apogee), the lunar tide-raising force is smaller, and the tidal ranges are less than average. A similar situation occurs between the Earth and the sun. When the Earth is closest to the sun (perihelion), which occurs about January 2 of each calendar year, the tidal ranges are enhanced. When the Earth is furthest from the sun (aphelion), around July 2, the tidal ranges are reduced (Sumich, J.L., 1996; Thurman, H.V., 1994).
Types and Causes of Tidal Cycles –Diurnal, Semidiurnal, Mixed Semidiurnal; Continental Interference
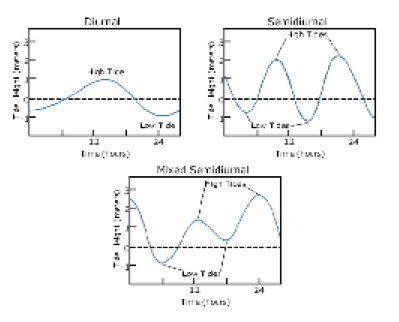
If the Earth were a perfect sphere without large continents, all areas on the planet would experience two equally proportioned high and low tides every lunar day. The large continents on the planet, however, block the westward passage of the tidal bulges as the Earth rotates. Unable to move freely around the globe, these tides establish complex patterns within each ocean basin that often differ greatly from tidal patterns of adjacent ocean basins or other regions of the same ocean basin (Sumich, J.L., 1996).
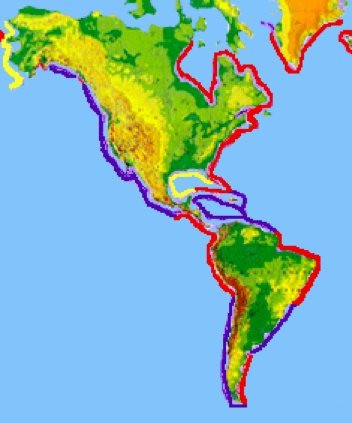
Three basic tidal patterns occur along the Earth’s major shorelines. In general, most areas have two high tides and two low tides each day. When the two highs and the two lows are about the same height, the pattern is called a semi-daily or semidiurnal tide. If the high and low tides differ in height, the pattern is called a mixed semidiurnal tide. Some areas, such as the Gulf of Mexico, have only one high and one low tide each day. This is called a diurnal tide. The U.S. West Coast tends to have mixed semidiurnal tides, whereas a semidiurnal pattern is more typical of the East Coast (Sumich, J.L., 1996; Thurman, H.V., 1994; Ross, D.A., 1995).
What Affects Tides in Addition to the Sun and Moon?
The relative distances and positions of the sun, moon and Earth all affect the size and magnitude of the Earth’s two tidal bulges. At a smaller scale, the magnitude of tides can be strongly influenced by the shape of the shoreline. When oceanic tidal bulges hit wide continental margins, the height of the tides can be magnified. Conversely, mid-oceanic islands not near continental margins typically experience very small tides of 1 meter or less (Thurman, H.V., 1994).
The shape of bays and estuaries also can magnify the intensity of tides. Funnel-shaped bays in particular can dramatically alter tidal magnitude. The Bay of Fundy in Nova Scotia is the classic example of this effect, and has the highest tides in the world—over 15 meters (Thurman, H.V., 1994). Narrow inlets and shallow water also tend to dissipate incoming tides. Inland bays such as Laguna Madre, Texas, and Pamlico Sound, North Carolina, have areas classified as non-tidal even though they have ocean inlets. In estuaries with strong tidal rivers, such as the Delaware River and Columbia River, powerful seasonal river flows in the spring can severely alter or mask the incoming tide.
Local wind and weather patterns also can affect tides. Strong offshore winds can move water away from coastlines, exaggerating low tide exposures. Onshore winds may act to pile up water onto the shoreline, virtually eliminating low tide exposures. High-pressure systems can depress sea levels, leading to clear sunny days with exceptionally low tides. Conversely, low-pressure systems that contribute to cloudy, rainy conditions typically are associated with tides than are much higher than predicted.
The Importance of Monitoring the Tides and Their Currents

Predicting tides has always been important to people who look to the sea for their livelihood. Commercial and recreational fishermen use their knowledge of the tides and tidal currents to help them improve their catches. Depending on the species and water depth in a particular area, fish may concentrate during ebb or flood tidal currents. In some areas, strong tidal currents concentrate bait and smaller fish, attracting larger fish. In addition, knowledge of the tides has also been of interest to recreational beachgoers and surfers.
Navigating ships through shallow water ports, intracoastal waterways and estuaries requires knowledge of the time and height of the tides as well as the speed and direction of the tidal currents. This was particularly critical to sailing ships because they had to take advantage of the tides and currents to manuever correctly. Knowledge of tides and currents is still critical because today’s vessels are much larger than the old sailing ships. The depths and widths of the channels in which they sail, and the increased marine traffic leaves very little room for error. Real-time water level, water current, and weather measurement systems now are being used in many major ports to provide mariners and port operators with the latest conditions.
Coastal zone engineering projects, including the construction of bridges, docks, etc., require engineers to monitor fluctuating tide levels. Projects involving the construction, demolition or movement of large structures must be scheduled far in advance if an area experiences wide fluctuations in water levels during its tidal cycle. Habitat restoration projects also require accurate knowledge of tide and current conditions.
Scientists are concerned with tides, water levels and tidal currents as well. Ecologists may focus on the tidal mixing of near-shore waters, where pollutants are removed and nutrients are recirculated. Tidal currents also move floating animals and plants to and from breeding areas in estuaries to deeper waters. Oceanographers or atmospheric scientists may study tidal fluctuations to better understand the circulation of the ocean and its relationship to world climatic changes.
How are Tides Measured? – The Old System

Since the early 1800s, NOAA and its predecessor organizations have been measuring, describing and predicting tides along the coasts of the United States. The longest continuous sea level records exists for the Presidio, in San Francisco, California. Records for the area date back to June 30, 1854. Today, the Center for Operational Oceanographic Products and Services (CO-OPS), which is part of NOAA’s National Ocean Service (NOS), is responsible for recording and disseminating water level data.
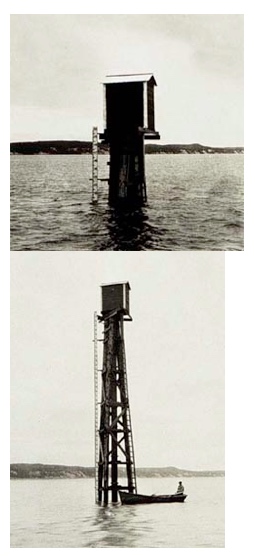
In the past, most water level measuring systems used a recorder driven by a float in a “stilling” well. A stilling well calms the waters around the water level sensor. A typical stilling well consisted of a 12-inch wide pipe. Inside the stilling well, an 8-inch diameter float was hung by wire from the recording unit above.
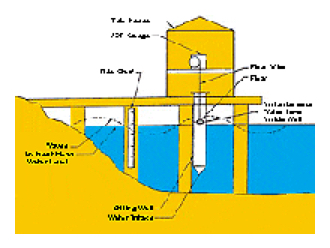
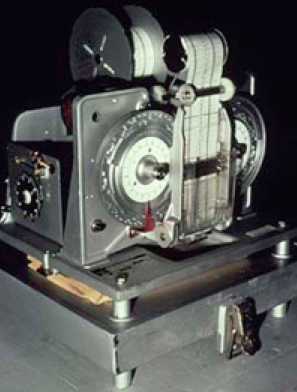
Before computers were used, water level data was recorded on a continuously running pen and ink strip chart. These records were collected by observers once a month and mailed to headquarters for manual processing. In the 1960s, data were recorded onto mechanically punched paper tape that were read into a computer for processing. Water levels were recorded at 6-minute intervals. Observers maintained and adjusted the clocks, and calibrated the gauges with the tide readings. Tide stations were visited annually to maintain the tide houses and clean biological fouling from the underwater surfaces. During these annual visits, the components and support structures also were checked for stability.
Although these systems worked well, they had their limitations. Stations were subject to recording errors and marine fouling, and were constantly in need of maintenance. In addition, the measurement and data processing equipment could not provide users with information until weeks after the data was collected.
How are Tides Measured? – The New System

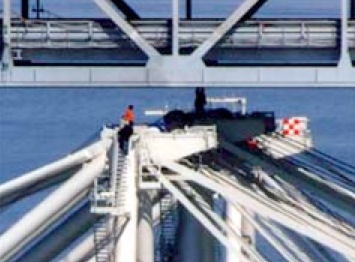
Advances in technology have helped solve many of the problems associated with the old tidal recording systems. Microprocessor-based technologies allow for customized data collection and have improved measurement accuracy. While older tidal measuring stations used mechanical floats and recorders, a new generation of monitoring stations uses advanced acoustics and electronics. Today’s recorders send an audio signal down a half-inch-wide sounding tube and measure the time it takes for the reflected signal to travel back from the water’s surface. The sounding tube is mounted inside a 6-inch diameter protective well, which is similar to the old stilling well.
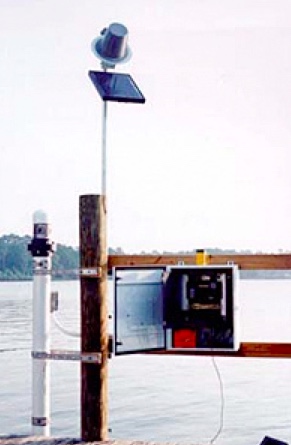
In addition to measuring tidal heights more accurately, the new system also records 11 different oceanographic and meteorological parameters. These include wind speed and direction, water current speed and direction, air and water temperature, and barometric pressure.
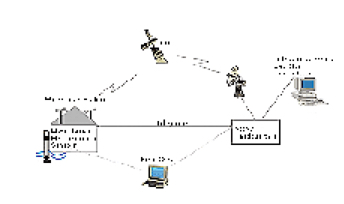
Like the old recorders, the new measuring stations collect data every six minutes. However, whereas the old recording stations used mechanical timers to tell them when to take a reading, timing is controlled on the new stations by a Geostationary Operational Environmental Satellite (GOES). The stations also use these satellites to transmit their data hourly to NOAA headquarters. In the event of a storm, the stations can be programmed to transmit their data every six minutes. Field teams can quickly check and maintain the systems using laptop computers. In addition, all of the raw and processed data are available over the Internet.
References
Ross, D.A. 1995. Introduction to Oceanography. New York, NY: HarperCollins. pp. 236-242.
Sumich, J.L. 1996. An Introduction to the Biology of Marine Life, sixth edition. Dubuque, IA: Wm. C. Brown. pp. 30-35.
Thurman, H.V. 1994. Introductory Oceanography, seventh edition. New York, NY: Macmillan. pp. 252-276.
Tides Roadmap to Resources
These online resources are meant to guide students and educators to topics presented in the online tides and water levels tutorial. The following links will take you to specific Web pages created and managed by NOAA�s Center for Operational Oceanographic Products and Services (CO-OPS). CO-OPS predicts, records and distributes oceanographic and meteorological data from thousands of monitoring stations in U.S. coastal and territorial waters.
Please note: The Web links provided have been checked at the time of this page’s publication, but the linking sites may become outdated or non-operational over time. If you should come across a non operational link please contact NOAA Ocean Service Education at oceanserviceseducation@noaa.gov
http://tidesandcurrents.noaa.gov/restles1.html
“Our Restless Tides” provides comprehensive information about the astronomical and physical forces that cause and affect the world’s tides. Detailed diagrams and mathematical formulae illustrating the forces acting on the world’s oceans are presented.
http://tidesandcurrents.noaa.gov/publications/glossary2.pdf (28 pages, pdf, 600Kb)
The “Glossary of Tide and Current Terminology” is and indispensable reference tool lists and defines more than 400 terms and concepts concerned with the tidal phenomena and its measurement.
http://tidesonline.noaa.gov/geographic.html
The “NOS Water Level Observation Network” lets you to access graphic presentations of predicted and observed water levels, air and water temperatures, wind speed and direction, and air pressure in real time from U.S. coastal and territorial waters. After clicking on a state, select a tidal monitoring station and click on it. Predicted readings for an area will appear in blue, and actual observations will appear in red. To view a good example of a diurnal tidal cycle, select a tidal station in Louisiana, Mississippi or Alabama. To see semi-diurnal tides, select a coastal monitoring station from a northeastern state such as Delaware or Maine. Note that the tidal range increases as you move further north. To observe mixed semidiurnal tides, select any one of the tidal stations on the west coast.
http://tidesandcurrents.noaa.gov/ports.html
The “Physical Oceanographic Real Time System” (PORTS�) Web site provides real-time oceanographic and meteorological data for 15 major U.S. harbors. After selecting a particular harbor, you can view the types and geographic placement of different sensors in that area by clicking on the sensor locations highlighted on the area maps. To zoom in on a particular area where an instrument is stationed, click on the “plus” symbol in the upper left hand side of the image. You can reorient the image by “dragging” it with your mouse or using the arrow buttons on the upper left hand side of the image. To view specific data for a particular sensor in graphic format click on the image of data graph you wish to view. To view the data in ASCII, or text format, scroll down the page of the graphic presentation and click on the link to the data set you want to see.
http://glakesonline.noaa.gov/geographic.html
The “NOS Water Level Observation Network – Great Lakes” Web site provides real-time observations of water levels for seven of the eight states bordering the five Great Lakes. You can select a particular monitoring station by choosing a state and clicking on it. A map will appear showing the geographic locations of all the monitoring stations in the state. Select one of these stations to view a graph of water levels in real time at that site for a 24-hour period. To view the data in ASCII, or text format, scroll down the page and click on the link to the data listing.
http://tidesandcurrents.noaa.gov/tide_pred.html
This Web site provides you with tidal predictions computed by CO-OPS for more than 3000 tidal current stations. Click on the year for which you want tidal prediction data. This opens a new page with a list of states and other areas for which there are tide stations on the left side of the page. Clicking on a state name displays a list of regions within that state. Clicking on a region name will present a list of the tidal current stations in the area. These stations are listed geographically. This will make finding the location you are interested in, or a nearby station, simpler.
Unlike tide stations, which are normally located along the shoreline, most tidal current stations are located offshore in channels, rivers, and bays. These stations are often named for the channel, river, or bay in which they are located or for a nearby navigational reference point. A map or some personal knowledge of the area may help you identify stations.
To access tidal current data from 2004 through 2006 go to: http://tidesandcurrents.noaa.gov/products.html On the left hand side of the page look beneath “Predictions” and then beneath “Published Current Tables” click the year for which you wish to view tidal current data.
http://tidesandcurrents.noaa.gov/ station_retrieve.shtml?type=Tide+Predictions
Similar to the tidal current prediction Web site above, this site provides you with water level predictions for more than 3000 water level stations. The list of stations may be selected from a listing on the main part of the page, or from a sub-listing of stations broken down by state which can be accessed on the left hand side of the page. You can also use the interactive map feature accessible from the page to search for a tidal station geographically.
To access tidal data from 2004 through 2006 point go to: http://tidesandcurrents.noaa.gov/products.html On the left hand side of the page look beneath “Predictions” and then beneath “Published Tide Tables” click the year that you wish to view tidal current data for.
http://tidesandcurrents.noaa.gov/about2.html
“About Water Levels, Tides & Currents” provides links to additional information including Tide Predicting Machines, How Does One Measure Water Levels, Why Does One Measure Water Levels, and The Challenge of Measuring Water Currents.
http://tidesandcurrents.noaa.gov/publications/ Understanding_Tides_by_Steacy_finalFINAL11_30.pdf (83 pp, 1.9M)
“Understanding Tides” is a technical publication authored by Stacy Dopp Hicks, provides in-depth explanations of many aspects of tides, including Gravitational Attraction, Sun-Earth and Moon-Earth Systems, Spring and Neap Tides, Tide-Generating Forces, Tidal Waves in Gulfs and Estuaries, Tidal Bores, and Tidal Harmonic Constituents.
Last revised 24-Jan-16
