
Rocky Intertidal Monitoring – 20 Year Report Synopsis – Official Report In Progress
The following is a synopsis of the rocky intertidal monitoring program from 1990-2010. If you’re unfamiliar with this program, you may be interested in reading the background. If you have helped us collect these data, or heard us talk about this program a lot, you may want to skip to the good stuff below. Results for each organism we count/measure are presented in various sections.
Background
Cabrillo National Monument (CABR) is a unit of the National Park System located in San Diego, California on the tip of Point Loma, a peninsula that separates San Diego Bay from the Pacific Ocean. Although it is a small urban park (160 terrestrial acres), it receives almost one million visitors every year. In 2011 we recorded around 230,000 visitors visiting the general coastal area of Cabrillo alone.
The rocky intertidal zone at Cabrillo is beloved by many and unique along the southern California shoreline. Visitors include all types of citizens, young students, city dwellers, international visitors, burgeoning marine biologists, old marine biologists at the end of their careers, country folk, etc. Five bucks will get your car in for the week, and you don’t need SCUBA gear, swimming lessons, or a boat to explore a rich and diverse marine ecosystem full of exciting organisms not seen anywhere on land. What makes this stretch of coastline unique is the fact that part of it is kept almost completely free of human foot traffic. This is very important, because it allows us to see what a rocky intertidal environment looks like if it is near a city, exposed to general coastal pollution and all the impacts an urban area might impart, but without the human foot traffic and consumptive activities (shell collecting, fishing, etc.).
This fact is also of special interest to the National Park Service because we as an agency are charged with protecting our natural resources, while also providing for their enjoyment by the general public. Finding the balance between preservation and visitation is no easy task, and in a place like the rocky intertidal, it is especially difficult. At Cabrillo, we can use this unique setup to see how we’re doing in working towards our mission.
How do we do this? One way is to set up a long-term monitoring program. Cabrillo did this in 1990. And we’ve managed to keep it running since then, with only a small gap in 1996. Twice a year we go out into the intertidal and count all kinds of organisms the same way and in the same place every time. We chose organisms that seemed like they had a big impact on the other species around them, were relatively well understood by scientists, were especially sensitive to oil spills, or were something that people really liked to eat. This type of monitoring has since been established up and down the west coast at over 100 different sites, including several other National Park units. That’s really important, because since the methods are conducted the same way everywhere, we can look for differences between sites or regions and know they are not due to different methods of data collection.
Before we delve into the results for Cabrillo, there are a couple really important points to get across to you, dear Cabrillan. First, the fundamental question a monitoring program like ours seeks to answer is whether something changed over time. Of course, we expect some change to occur naturally. The big questions are how much are things changing, and are those changes a big deal, or not? Second, detecting small changes, say an increase in the barnacle population of 5%, takes a lot more time, money and expertise than detecting big large swings in population, say a decrease in 50%. As monitoring goes, we’re a shoestring operation. We have an 80% chance of detecting a 50% change. So the larger the change the more confident we are that we’re seeing something real, instead of something erroneous, like counting the wrong limpets, or the marine biologist’s shoe in a photoplot or something. Finally, what this monitoring can’t tell us is why those changes occur. If we find a big change and we want to know why, we need to direct more focused research at the issue. Our intertidal monitoring program is just the bellwether, some dude standing on the beach shouting, “Hey! I think there is something big going on here! You better pay attention!” Fortunately, we can get a few clues which then help us focus greater research efforts on answering the why part.
For those of you who are unfamiliar with the way the intertidal at Cabrillo is managed, there are three “zones” along the shoreline. We simply call them Zone 1, Zone 2 and Zone 3. Zone 1 is where people enter the intertidal, and it gets all the visitors and all the foot traffic. Zone 2 takes a little more gumption to get to on the part of the casual visitor; a few hundred more yards of walking and picking your way through some slippery boulders, but that’s all. Somewhere between 10 and 25% of the visitors who enter Zone 1 make it to Zone 2, further south. Zone 3 is where we turn people back. Only about 10% of those who make it to Zone 2 venture as far as Zone 3 anyway, so it’s not too difficult to keep this area people-free. We only go in there to conduct our monitoring, and the occasional researcher goes in to conduct research of interest.
Many Cabrillans have helped us collect our monitoring data during low tides in the fall and spring. I’m sure you’re tired of my verbose introduction, so let’s get to the good stuff, eh? What have we found?
Lottia gigantea a.k.a. giant owl limpets
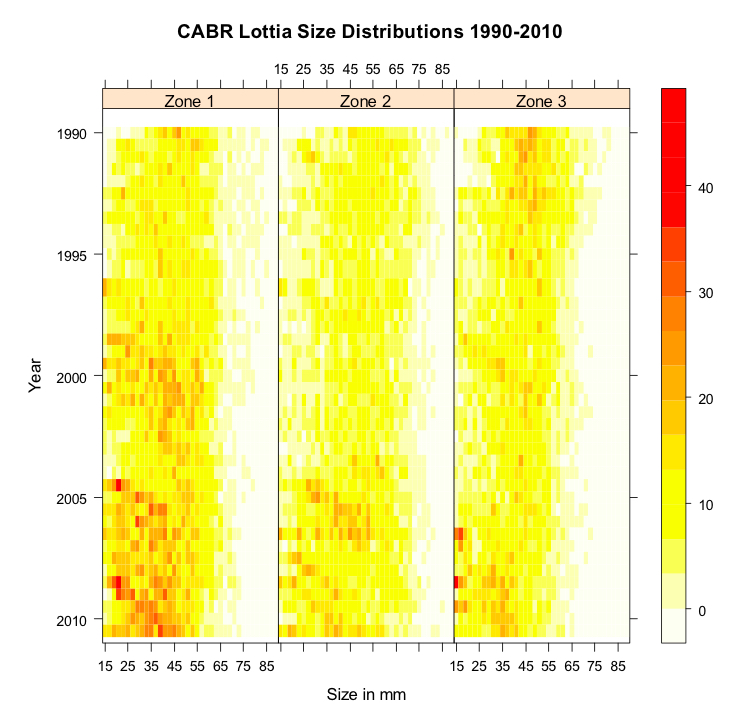
We use circular plots with a one-meter radius to count and measure giant owl limpets. Our giant owl limpets have been getting smaller by an average of 5mm per decade in all three zones. There seems to be both an increase in mortality (death rate) and a decrease in growth rate. We would need both to explain the shift in size distribution to smaller individuals that we have observed.
There has been an increase, particularly from 2005 to 2010, in recruitment. That means lots of small juvenile limpets have arrived and managed to survive. As a result, there are actually more limpets in our plots now than when we started counting. This may have something to do with more territory opening up for smaller limpets as the big ones disappear. This isn’t necessarily a result we can feel good about, as it means we are losing our larger females from the population.
What does this mean? In short, life is getting harder for giant owl limpets, and it’s happening all over Cabrillo. Why, you may ask? We don’t know. Here is where we come to the limits of our monitoring program. In order to understand why, we need some more precise and directed research. What we do know is that it does not appear to be caused by people in the intertidal, because it’s happening in Zone 3 (where few people go) and Zone 1 (where lots of people go). It’s also happening very slowly by our standards. It’s not something like poaching, and would not appear to be predation or another animal chowing down on the limpets. These results suggest a larger change through the ecosystem, such as climate change or ocean acidification, or some other combination of factors. We don’t know. This is also a very cool result, in my nerdy opinion. Detecting a slow, long-term trend like this is exactly what our program is designed to do. It is also something a 2-4 year research project, the kind normally conducted by university researchers, would miss. Finally, the limpets at Cabrillo are still larger than those found elsewhere in southern California (except the Channel Islands). So the limpet population still looks very healthy compared to most other places. That is something we should feel good about.

Mytilus spp. a.k.a. mussels
Let’s talk mussels. We count mussels in photoplots. We take a photo of a rectangular plot on the rocks. The plots are marked by bolts, so we know we’re in the same spot each time. Then in the office, we throw 100 dots over the picture using Photoshop, and count everything under the dots. Our mussels are kinda messed up. And it’s very peculiar. The mussel results are the most enigmatic of all the data we have collected at Cabrillo.
When we began monitoring back in 1990 it appears that our mussels were in the midst of a crash. There were more mussels in Zone 2 and 3 than in Zone 1, but all of them took a nosedive for about four years. Then around 1994 and 1995 the mussels, in Zone 1 only, got more abundant, then leveled off around 1998. Such locally constrained increases (Zones 2 and 3 are only a few hundred yards away) seems odd for this species. Also around 1998, all three zones began very slowly increasing. After 1998, the mussels in all three zones behave similarly, very slowly increasing. It looks different in a graph because there are more of them in Zone 1 than in Zone 2 or 3. But they are all basically slowly increasing. These kinds of mussels used to be very abundant at Cabrillo. We’ve got pictures form the 1960s to prove it. And when they recruit, they often do so in great abundance, smothering everything in the mid intertidal. We should be seeing close to 100% cover in several places from time to time, if our mussels were healthy. Our mussels are big and geriatric, and few and far between, even in Zone 1. Something is not right with our mussels. Our observations suggest that this is indicative of all of San Diego county and perhaps southern California in general. There are no mussels further north on Point Loma. And few to no mussels between Cabrillo and Scripps, in La Jolla. Still, we can’t get over how peculiar the local results between Zones 1 and Zones 2 and 3 are. Dr. Bonnie Becker, a previous marine biologist at Cabrillo, spent her entire Ph.D. thesis trying to figure out what the heck was going on with mussels at Cabrillo, and basically eliminated a whole bunch of possibilities, but was never able to really pin down what the cause was. She essentially concluded that the mussels at Cabrillo were not getting enough food at various points in their life cycle. Or, they weren’t recruiting, perhaps never even reaching Cabrillo as larvae, which is critical for new mussels to colonize. Or a combination of the two. More research is needed. We just haven’t found the money to do it.

Chthamalus spp./Balanus sp. a.k.a. acorn barnacles &
Tetraclita rubescens a.k.a. thatched barnacles
In case you’re wondering, the Ch in Chthamalus is silent. Start with the th. There are several species of barnacles all monitored in the same photoplots. They are all of the same general run-of-the-mill barnacle appearance. We monitor them the same way we monitor the mussels.
These species of barnacles increased and decreased a lot over the 20 years from 1990-2010. In fact, they’re kind of all over the place without any real strong obvious trends. This suggests that there haven’t been any large changes influencing our barnacles, and what we have been seeing is a normal amount of background variation. This also jives with what has been reported in the scientific literature. That’s a good thing. If we do see large changes, we’ll have a solid baseline to compare them to.
The barnacles aren’t completely without trends, however. There are slightly more of them in Zone 3 than in Zone 1. It’s not clear whether this is directly related to people trampling them, or something else. For example, people scare away birds. If the birds eat snails that eat barnacles, then there should be more barnacle predators in Zone 1, and therefore fewer barnacles. We simply don’t know. Again, we’re at the limits of our monitoring program. Regardless, it’s not something we’re concerned about.
Another almost interesting trend is that acorn barnacles tend to increase or decrease in opposition to thatched barnacles. For example, acorn barnacles increased in the 1990s, and thatched barnacles decreased. Since the early 2000s, the opposite has been true. Now, we’re measuring these barnacles in the same plots, so it is possible they are competing with each other for space. When one does well, the other doesn’t. That’s one hypothesis, anyway.
Regardless, there isn’t enough going on with barnacles to get us all hot and bothered like with owl limpets or mussels. I’m not even going to include a graph. These barnacles are just doing their thing, hanging out in the intertidal feeling groovy, content in the fact that each of them has the largest schlong, proportionately, in the animal kingdom. Which basically means they rule the entire planet when it comes to penis size. How would you like to hang your hat on those laurels, eh? One thing to consider, though, is that they are hermaphrodites. So everyone’s got one. And it won’t save you if you get stepped on by a visitor.
Pollicipes polymerus a.k.a. gooseneck barnacles a.k.a. goose barnacles
If there is an organism we have been monitoring that is even more ho-hum than our acorn and thatched barnacles, it would be the gooseneck barnacles. These are the kind of barnacles on stalks. We also count them using photoplots. Sometimes they increase, sometimes they decrease. They were more abundant in Zone 2 for a while, and then they were less abundant in Zone 2 for a while. Now all the zones are pretty similar. And none of them changed very much. One thing we did notice is that the clumps of gooseneck barnacles grow in pretty much the same place all the time. Even when they disappear entirely for a year or two, they return in the same spot.
Of interest is that traditionally along the west coast gooseneck barnacles are closely associated with mussels. We typically see them mashed together. Instead, at Cabrillo, the gooseneck barnacles in the upper intertidal are by themselves. We know mussels used to cohabitate with them. What changed that made the mussels go away but the goosenecks stay? Who knows? But it did.
Like the acorn and thatched barnacles, the gooseneck barnacles appear to be doing their thing going through a generally natural level of variation over time and space. They make for boring graphs, but happy resource managers.
Silvetia compressa a.k.a. rockweed
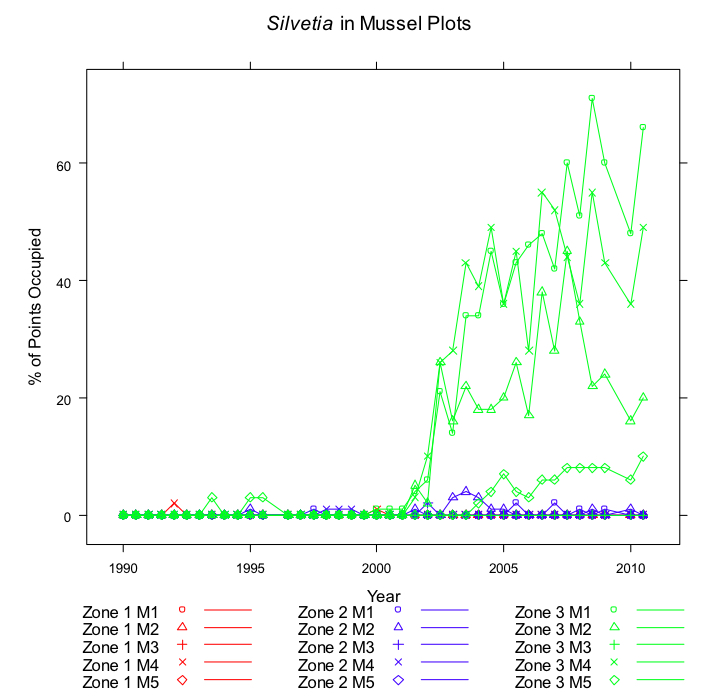
Rockweed is that dark green ropey seaweed you see all over the rocks in the middle intertidal. We monitor it using photoplots, just like mussels and barnacles. Rockweed appears to have decreased in the park after about 2005. It is also less abundant in Zone 1 than in Zones 2 or 3. This latter observation suggests visitors may be having an impact, and indeed rockweed often grows on the tops of low boulders where people step. And that is where a lot of our photoplots are. But the fact that it decreased in all three zones also suggests that there may be something else going on, too. Tiffany Yap, a grad student at UCLA, analyzed all the intertidal monitoring data from California and found that Silvetia compressa is declining significantly in central California, and less so in southern California. Why? Again, this is where we come up to the limit of our monitoring efforts. We don’t know.
But here is something else interesting about our rockweed; starting in 1999 it increased in barnacle plots in Zones 2 and 3. And starting in 2001 it really took off in mussel plots in Zone 3. So it has definitely increased in other parts of the intertidal. We checked to see if it could be changing its vertical distribution (how high in the intertidal it’s growing) but didn’t find anything special. Rockweed grows slowly, and it doesn’t recruit very often. It could simply have taken advantage of space mussels and barnacles vacated (when they died) and then held on since then.
Although we’re not terribly concerned at this point, the overall trend of rockweed is something Cabrillo needs to keep an eye on. If trampling in places like Zone 1 proves to be too much for Silvetia to handle, then trample free areas like Zone 3 become really important for maintaining the population, or restoration, if necessary.
Red Algal Turf a.k.a. . . . um . . . just turf
The algal turf at Cabrillo is made of up of small fleshy red algae and some coralline algae, all mixed together into a carpet-like matrix that is home to hundreds of tiny species, and billions of individual organisms at Cabrillo. It’s the nice fuzzy algae that many people like to walk on. In our monitoring program we use transects to keep track of it. We stretch the transects out between permanent bolts and count what’s underneath the tape every 10 cm for 10 meters, which equals 100 points. This red algal turf doesn’t occur very much to the north of Cabrillo. It seems to be a more subtropical and tropical kind of habitat.
Since we began monitoring, it appears that red algal turf remained steady, or perhaps even decreased a little bit until 2002. That is when we started keeping track of fleshy red algae and articulated corallines separately. The articular corallines have been steady or increased slightly in the different zones. The fleshy red algae have been steady or decreased slightly. But there have not been any big changes . . . in cover, which is how we measure the turf.
However, we may not be doing this in an informative way (it’s kind of hard to change now). Since turf is highly susceptible to trampling, it might be thickness that we should be measuring, rather than cover. It takes a lot of trampling to remove it completely, but not too much to make it a lot thinner. Dr. Tonya Huff, formerly a graduate student at Scripps, found that there were very big differences in the thickness of the turf, and its constituent organisms, between Zone 1 and Zone 3. This is something the park needs to be mindful of. Trampling by visitors, something that’s very hard to avoid, is definitely one of the greater impacts to the rocky intertidal at Cabrillo.
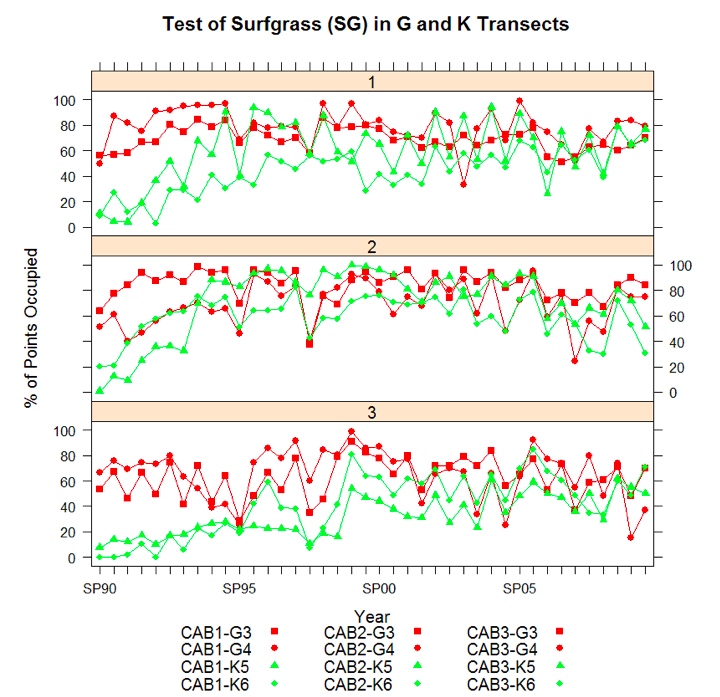
Phyllospadix torreyi/scouleri a.k.a. surfgrass &
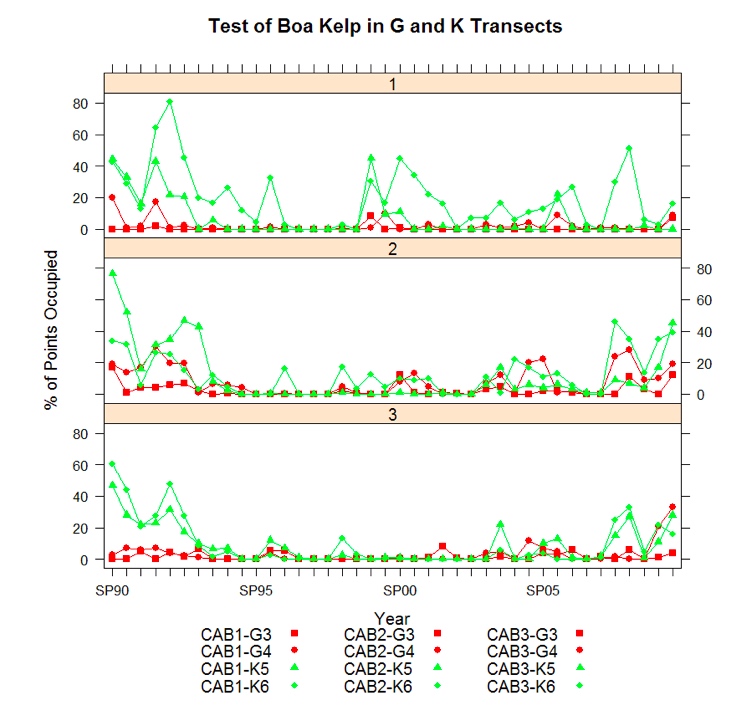
Egregia menziesii a.k.a. feather boa kelp
We also measure surfgrass and boa kelp in transects, just like the turf. They grow a bit lower in the intertidal than the turf but in pretty much the same place as each other. In the early 1990s boa kelp declined to near zero in our transects, and surfgrass increased. It’s important to note that there was boa kelp in other parts of the park. Around 2000 boa kelp started coming back in Zone 1, followed by Zones 2 and 3 starting in 2005, but notably in 2009 and 2010. Why this happened, of course, isn’t clear. Certainly surfgrass has remained dominant for the entire length of our monitoring program at Cabrillo. It is doing very well. Boa kelp was down for most of the 20 years of data we’re talking about here, but it did come back the last few years across the whole park. Cursory observations since 2010 (data is still being analyzed) suggest this trend continued, at least until 2012. Boa kelp is influenced greatly by nutrients and upwelling and is highly susceptible to disturbance by waves. It is also possible that boa kelp, which grows very fast and somewhat annually, simply moved around in patches within the intertidal. Regardless, the dynamics of boa kelp would appear to be driven by something other than visitor impacts.
Pisaster ochraceus a.k.a. ochre sea stars &
Haliotis cracehrodii a.k.a. black abalone
Abalone and sea stars are among the more charismatic organisms in the intertidal, and are two that many visitors, volunteers and park staff most want to see when they head out into the intertidal. The results of our monitoring are relatively straightforward and simple . . . there aren’t any. We haven’t found a single one in the 20 years we’ve been looking. Okay, we did find a single one. One ochre sea star back in 1994. But that’s it. We look for these organisms using a timed search. Someone searches for them right at low tide for 30 minutes in each zone. This is a method that is used when an organism becomes so uncommon at a site that setting up a spatial plot, like a photoplot or a transect, is impractical because there are so few individuals they are unlikely to occur within any one plot.
Black abalone were once abundant at Cabrillo, but went missing before we began keeping track in 1990. Basically people ate too many of them, and then they contracted a disease called withering foot syndrome that killed off almost all the rest. We have, on rare occasion, noticed a green abalone hanging around. We generally don’t brag about it because there are so few that they are in dire need of anonymity. The other species are also all rare in southern California, and in any case, don’t live in the intertidal. There are some pink, red, green and threaded abalone hanging out in the Point Loma kelp forest, but don’t let anyone tell you they’re doing okay. They are greatly diminished due to over fishing.
In terms of other sea stars, we used to see a lot more bat stars (Asterina miniata) prior to 1992. But since then they have been rare at Cabrillo. A few blue knobby sea stars (Pisaster giganteus) can be found here and there in all three zones, but also in low numbers. Despite the fact that visitors probably ask where they can see a sea star more than any other organism at Cabrillo, they continue to be very rare. They are simply no longer a meaningful part of the intertidal ecosystem in the San Diego area. A few can be found at Scripps, and supposedly in IB, as well. But in general sea stars (and abalone) are relatively rare throughout the entire county.
As mentioned in the introduction, this information will be included in the final Status and Trends of the Rocky Intertidal at Cabrillo National Monument 1990-2010, which is in progress. For the most recent published report: Status and Trends of the Rocky Intertidal at Cabrillo National Monument 1990-2005, continue reading the next document in this chapter.
Last revised 26-Aug-14
