Cabrillo National Monument – Where Volunteers Make A Difference
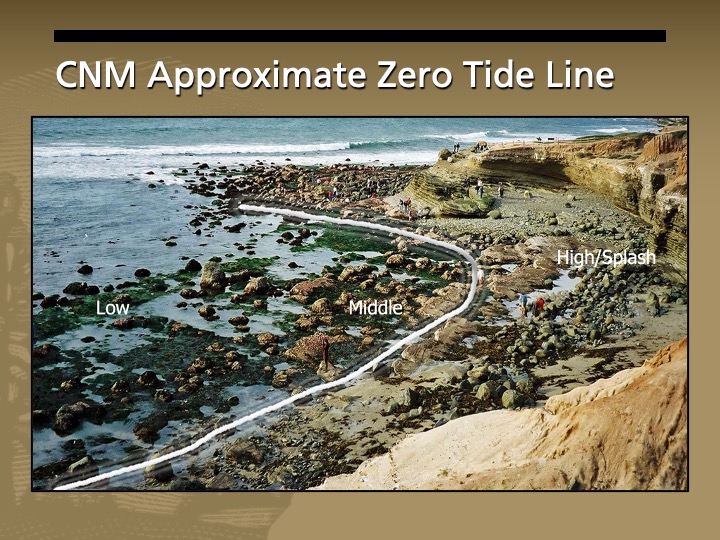
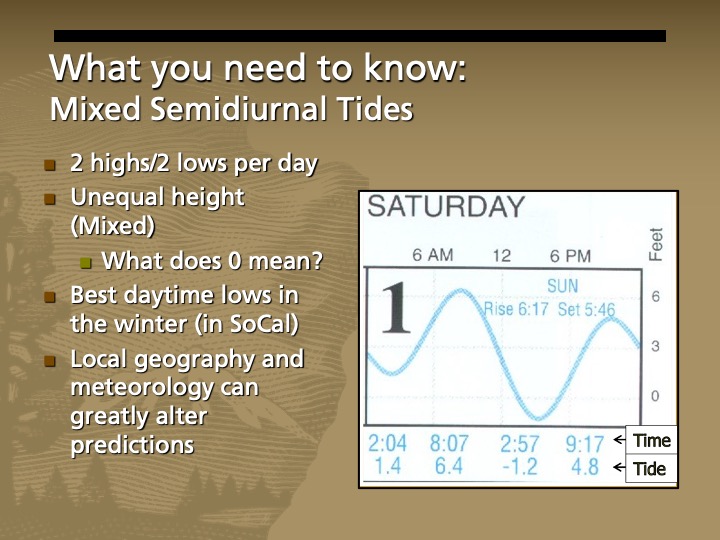
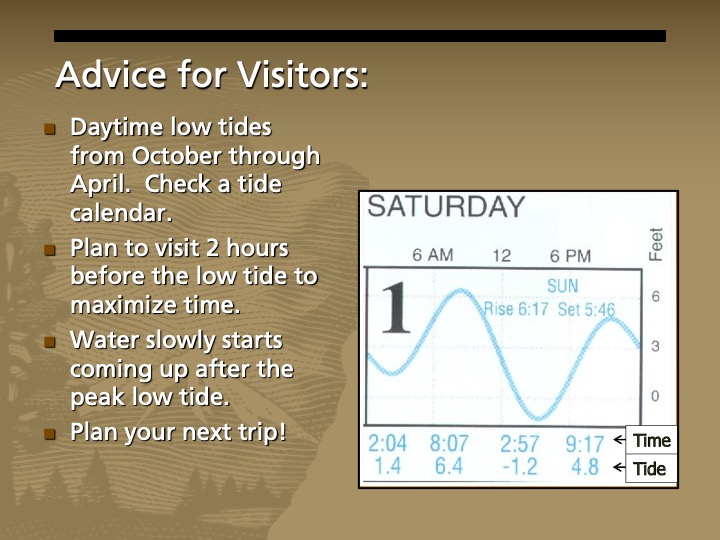
What Causes Tides
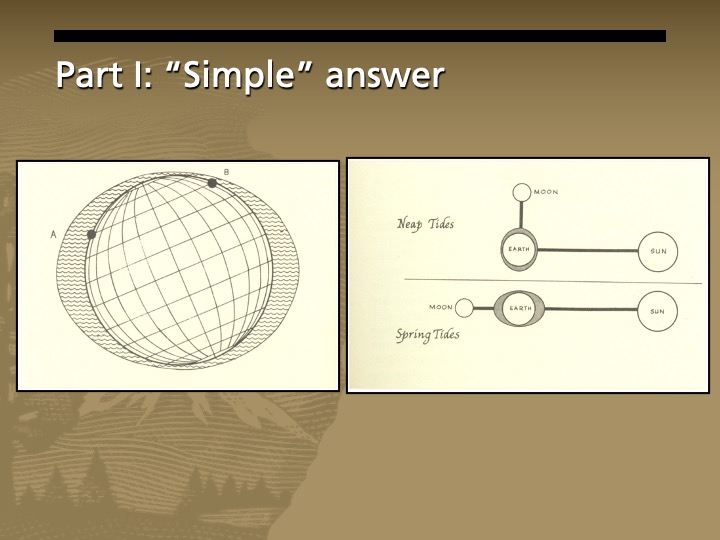
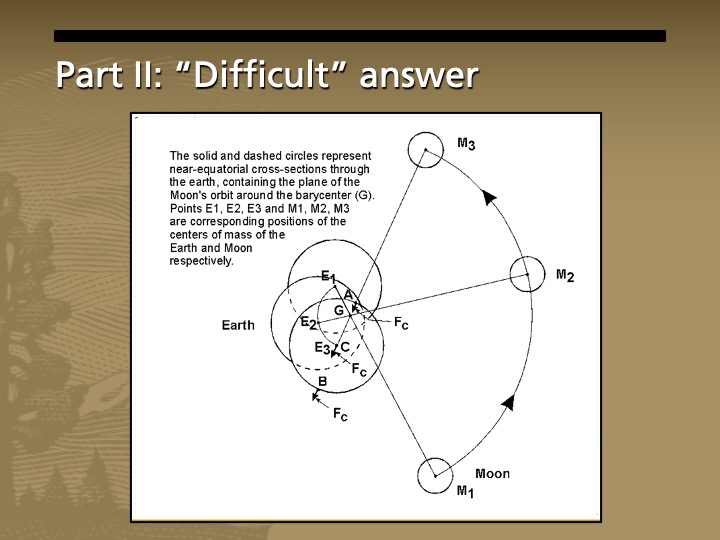
The solid and dashed circles represent near-equatorial cross-sections through the earth, containing the plane of the Moon’s orbit around the barycenter(G). Points E1, E2, E3 and M1, M2, M3 are corresponding positions of the centers of mass of the Earth and Moon respectively.
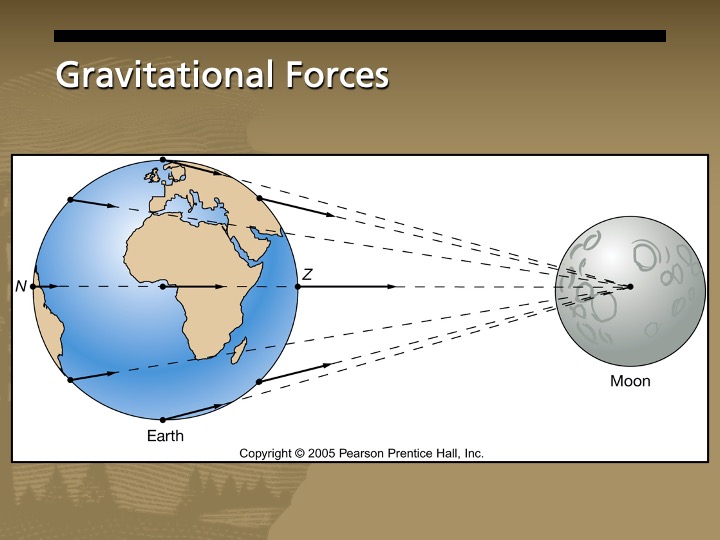
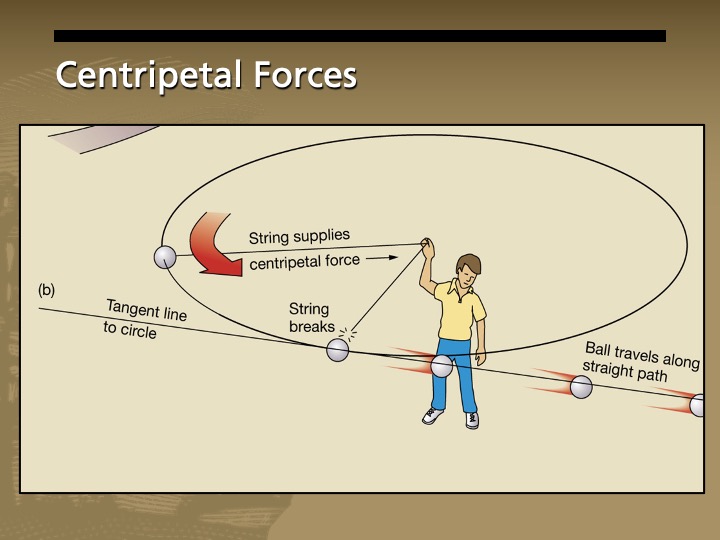
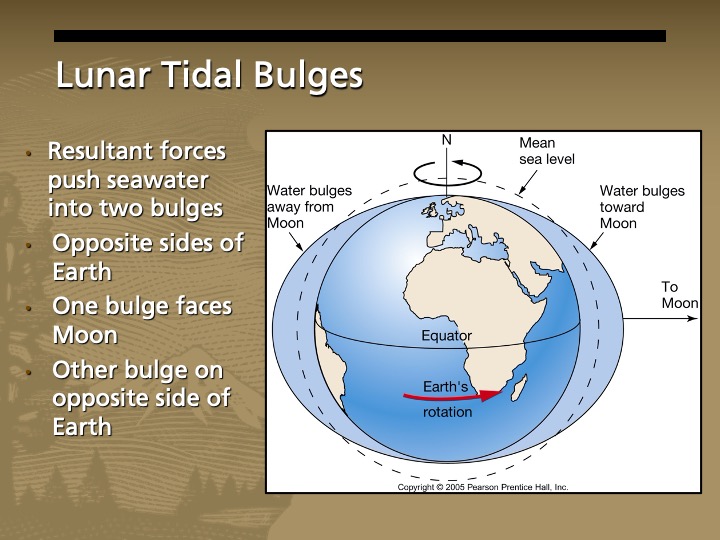
Gravitational force and centripetal force create RESULTANT FORCES – which generate the tides – those resultant forces become more horizontal at steeper angles – so the farther you get from the equator the greater the tidal range.
Constructive interference on a spring tide – the sun and moon align
Destructive interference during neap tides or quarter moon phases…. Wash each other out a bit.
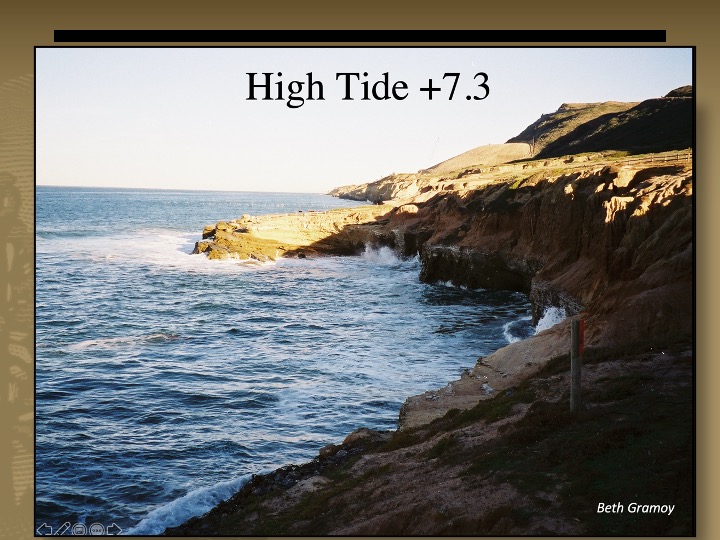
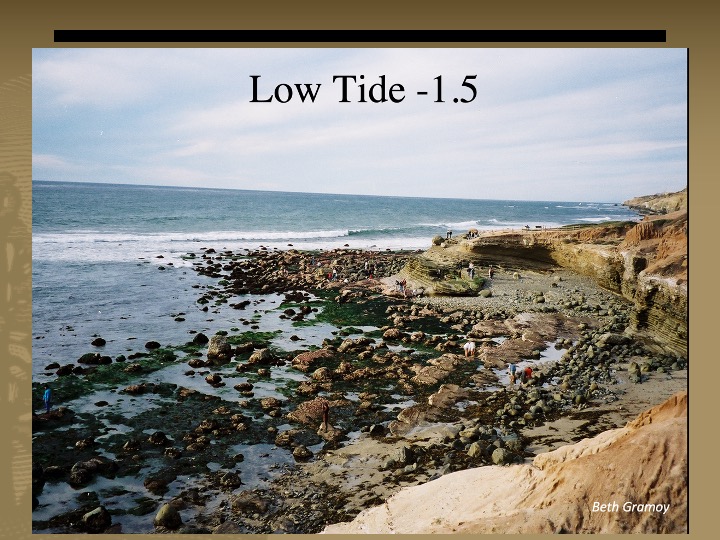
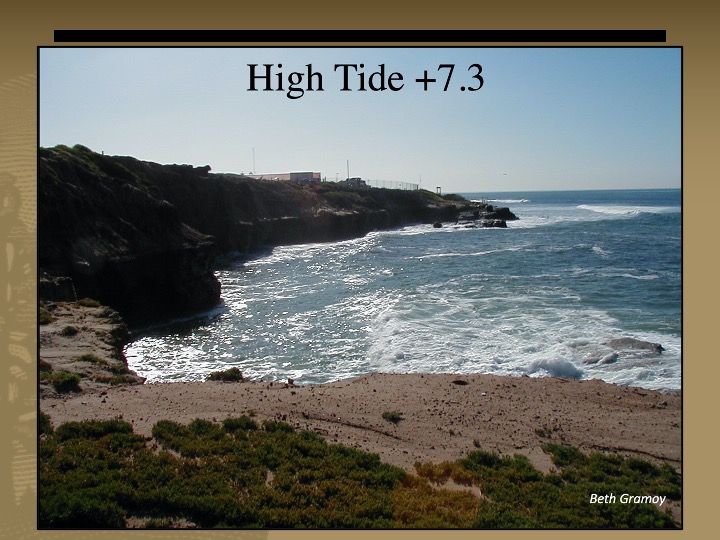
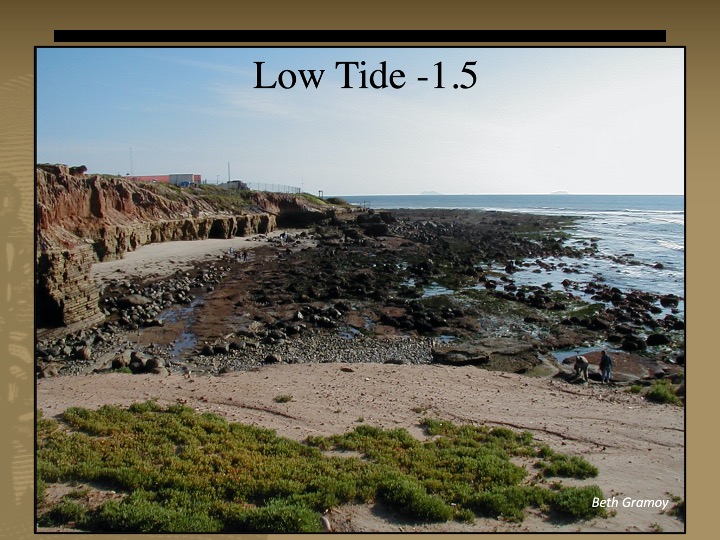
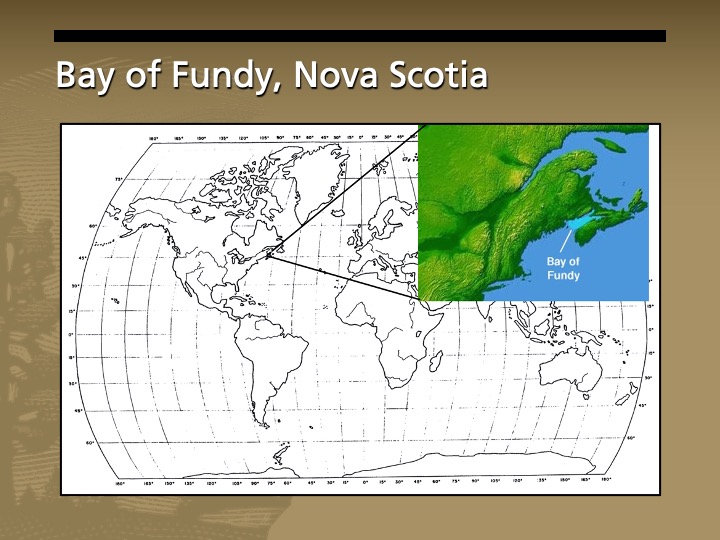
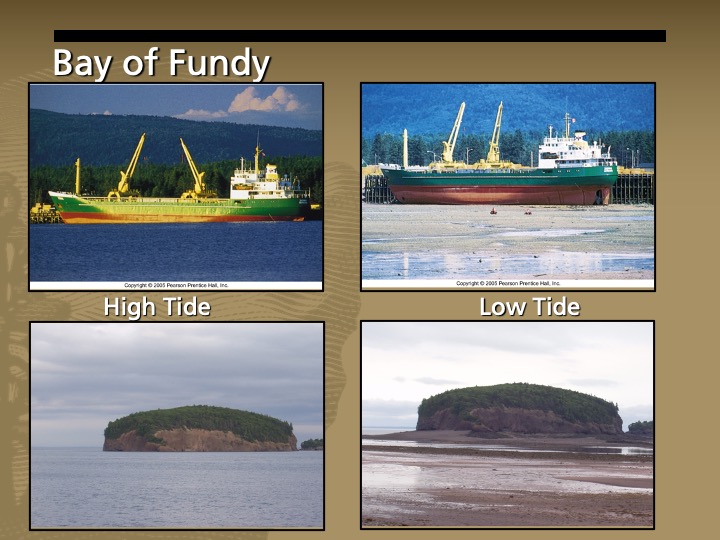
Nova Scotia, Canada – Bay of Fundy – extreme tidal ranges – most extreme spring tide – tidal range of 56 feet.