November 2026 – Tides

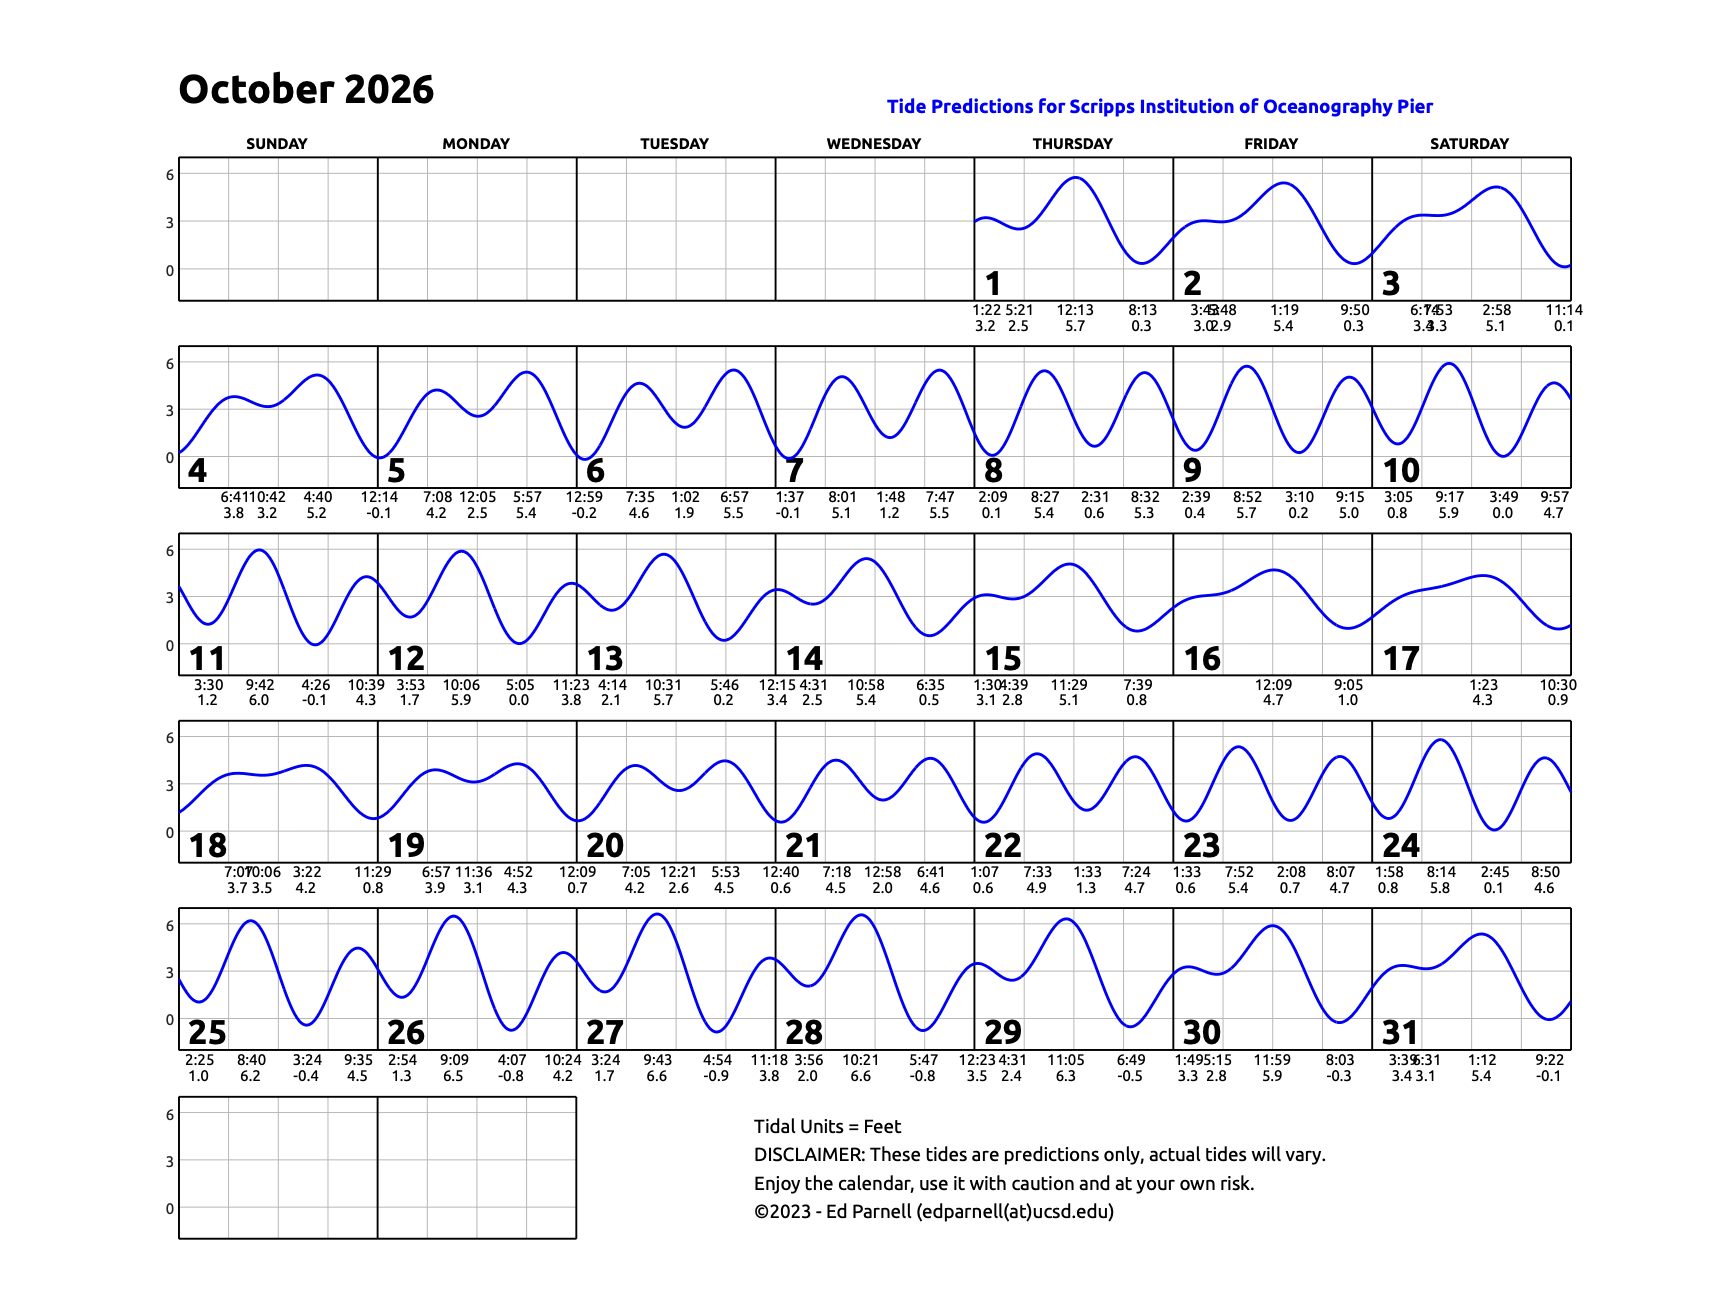
October 2026 calendar with single squiggly horizontal line through squares indicates high and low tides. Everyday the line goes down twice and up twice. Contact edparnell@ucsd.edu for more details about the calendar.

These are the predicted tide levels. With El Niño, we have been averaging 1.0-1.5ft above these predictions. The following graph shows for a few days in October the predicted tide levels in blue, the observed tide levels in red, along with the difference between the two.
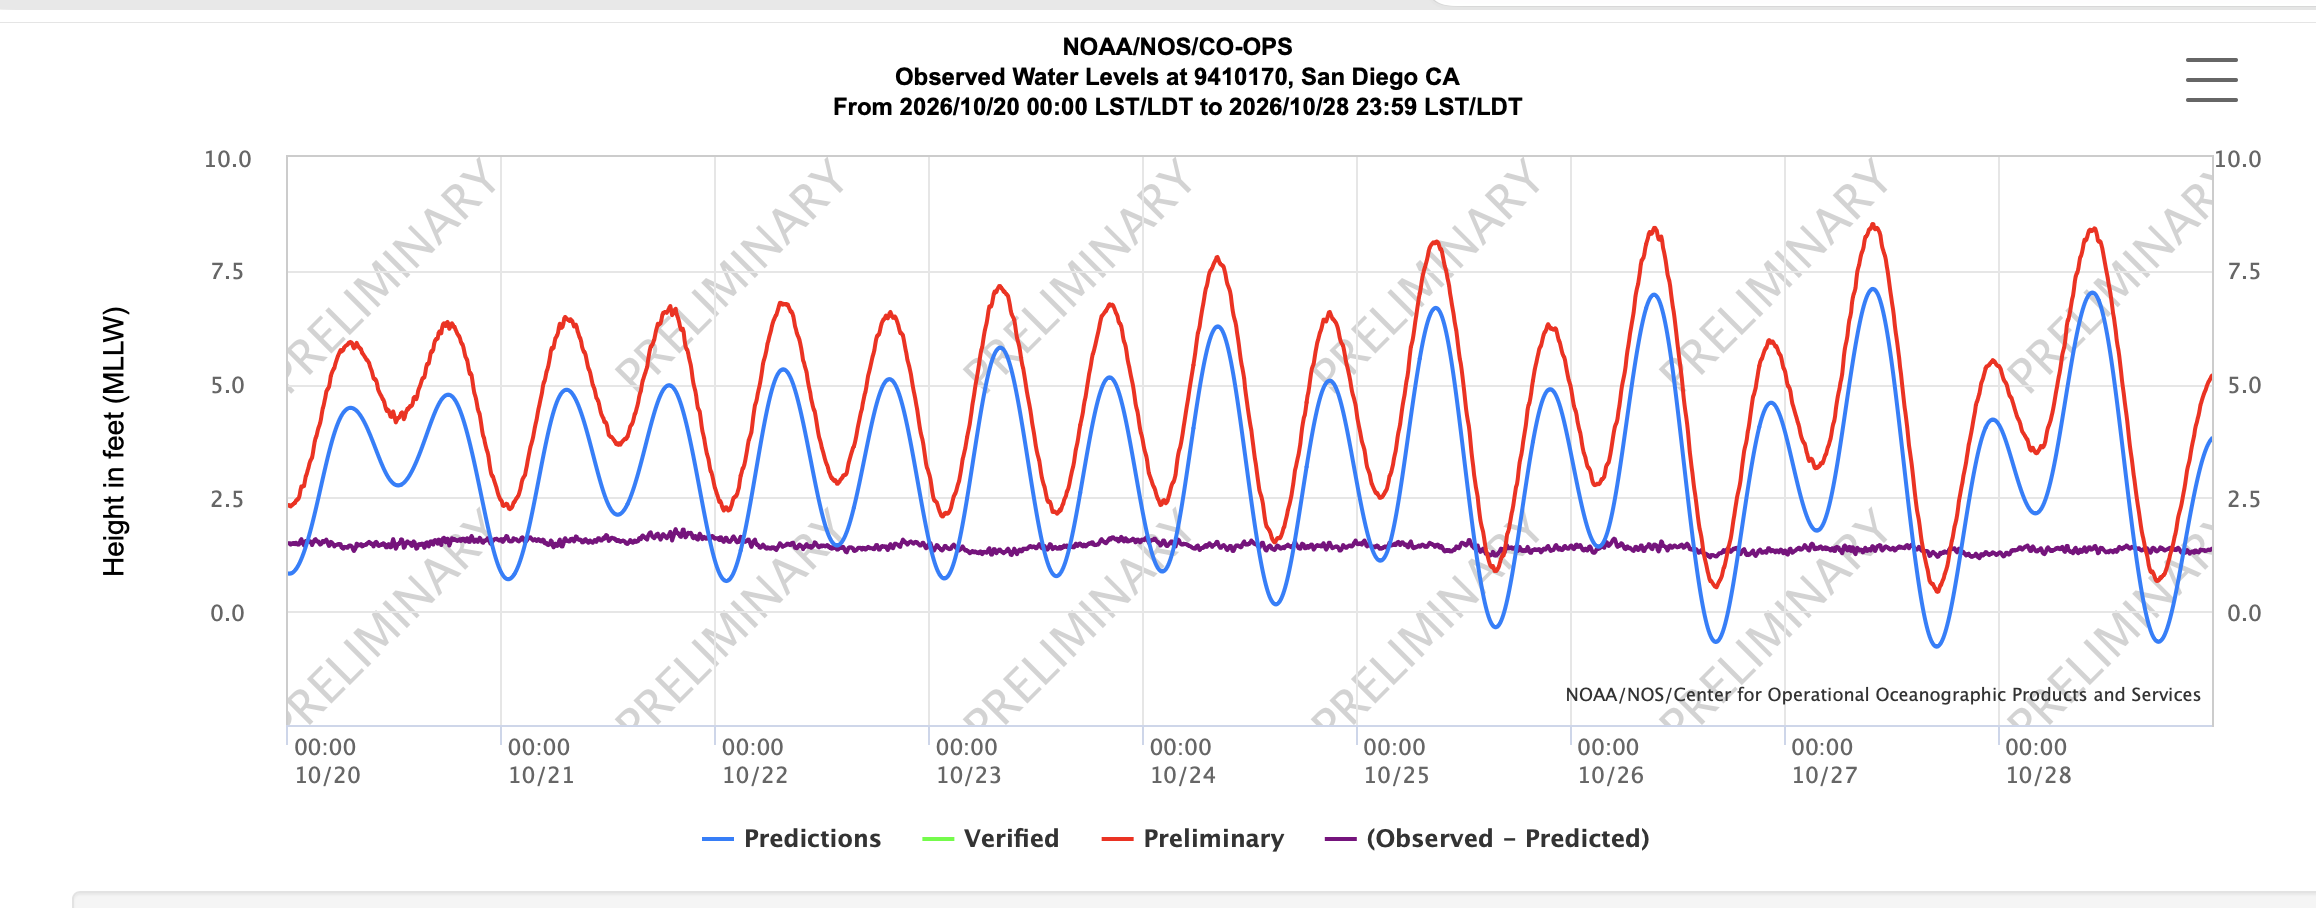
Graph showing the predicted tide levels, the observed tide levels and the difference.

If you want to play with the numbers on this graph you can use this link to the NOAA Tides and Currents website.

One thought on “November 2026 – Tides”

Leave a Reply

This site uses Akismet to reduce spam. Learn how your comment data is processed.